Group Analysis
How the biological groups overlap and how similar they are. Two views: Sets and Sample Correlations.
Sets
An UpSet plot of which features are detected in which groups. Each column is one combination of groups, marked by the dots underneath; the bar above it is the number of features found in exactly that combination. The bars on the left are the total number of features in each group.
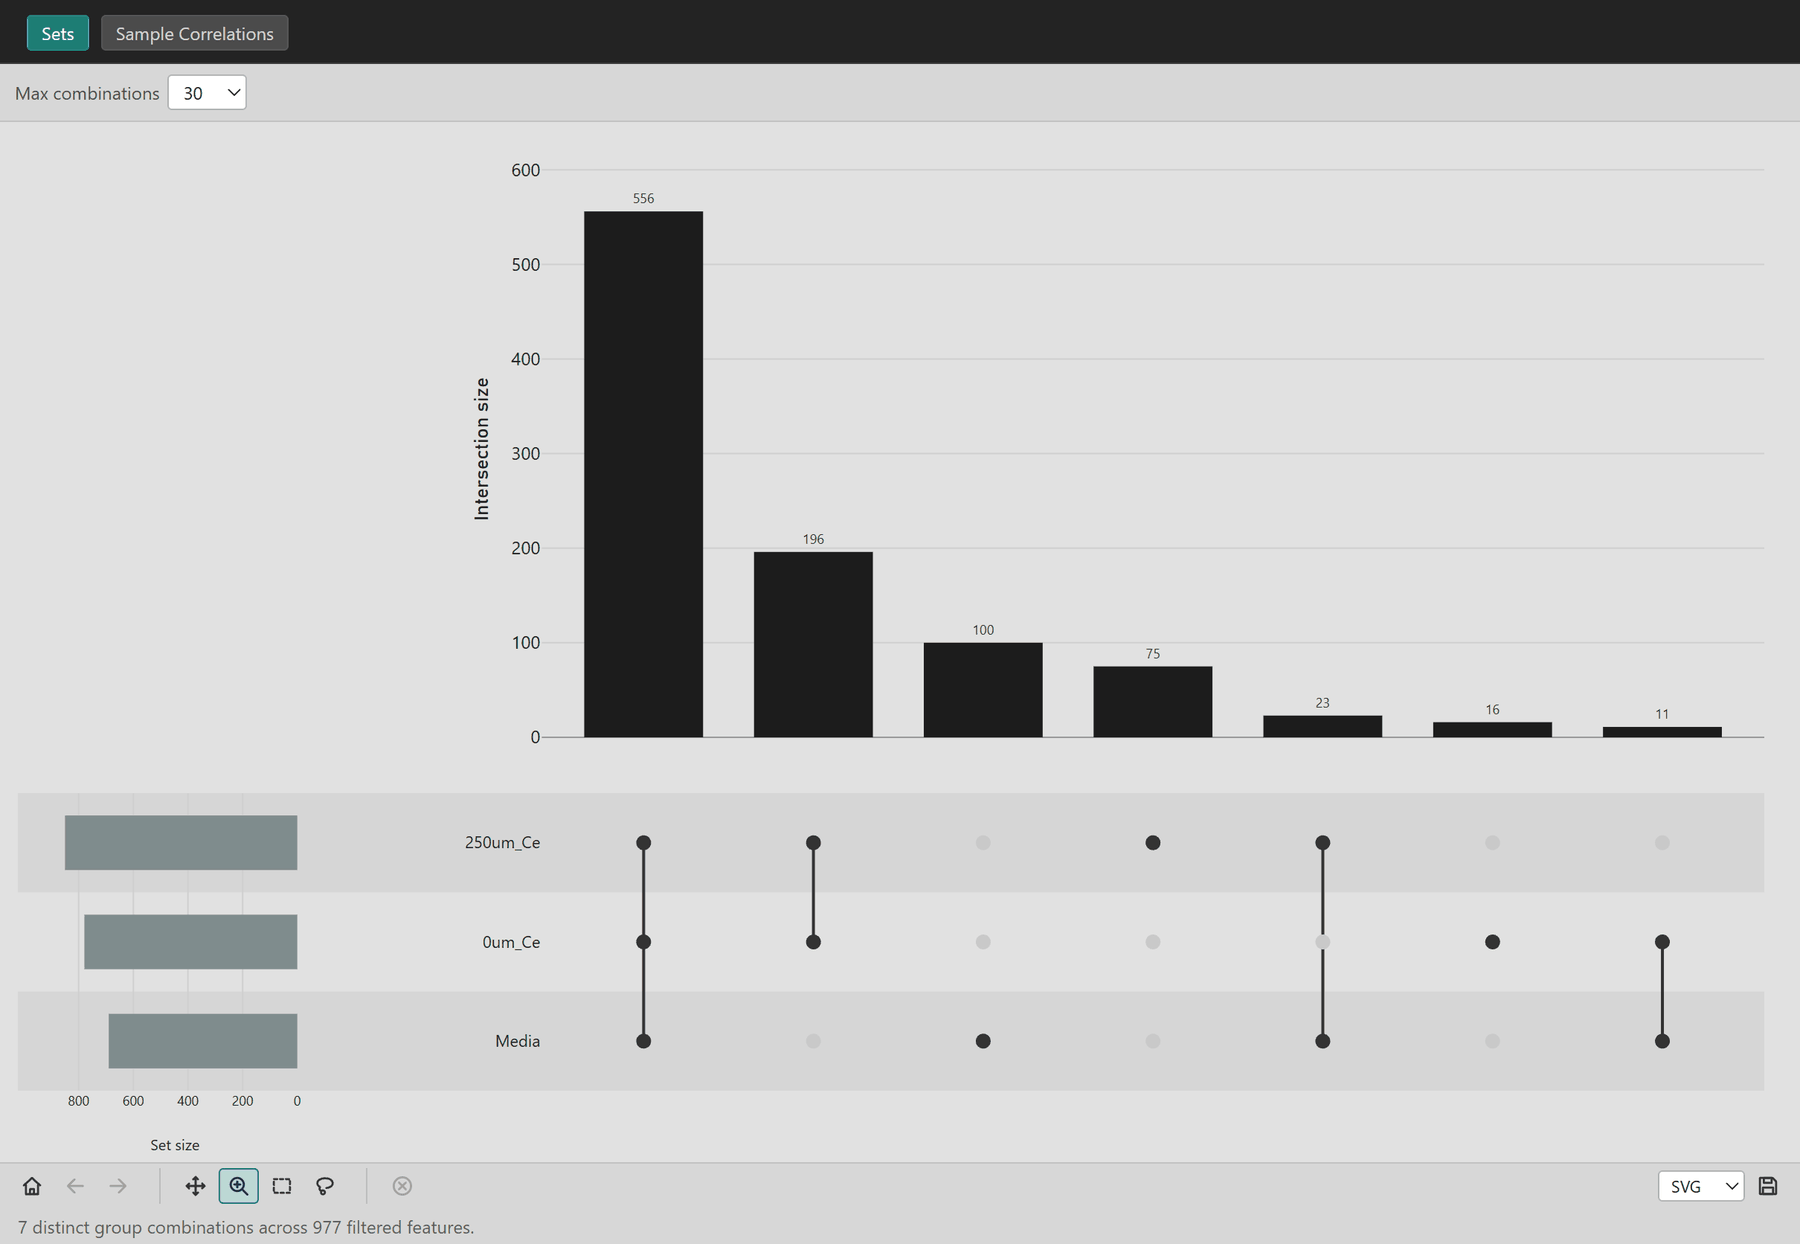
In the demo, 556 features are shared by all three groups, and 100 are found only in the media control. Max combinations limits how many columns are drawn, largest first.
"Detected" uses the presence threshold from Filtering Settings. The blank group is not shown when blank filtering is on.
Sample Correlations
A matrix of how similar every pair of samples is.
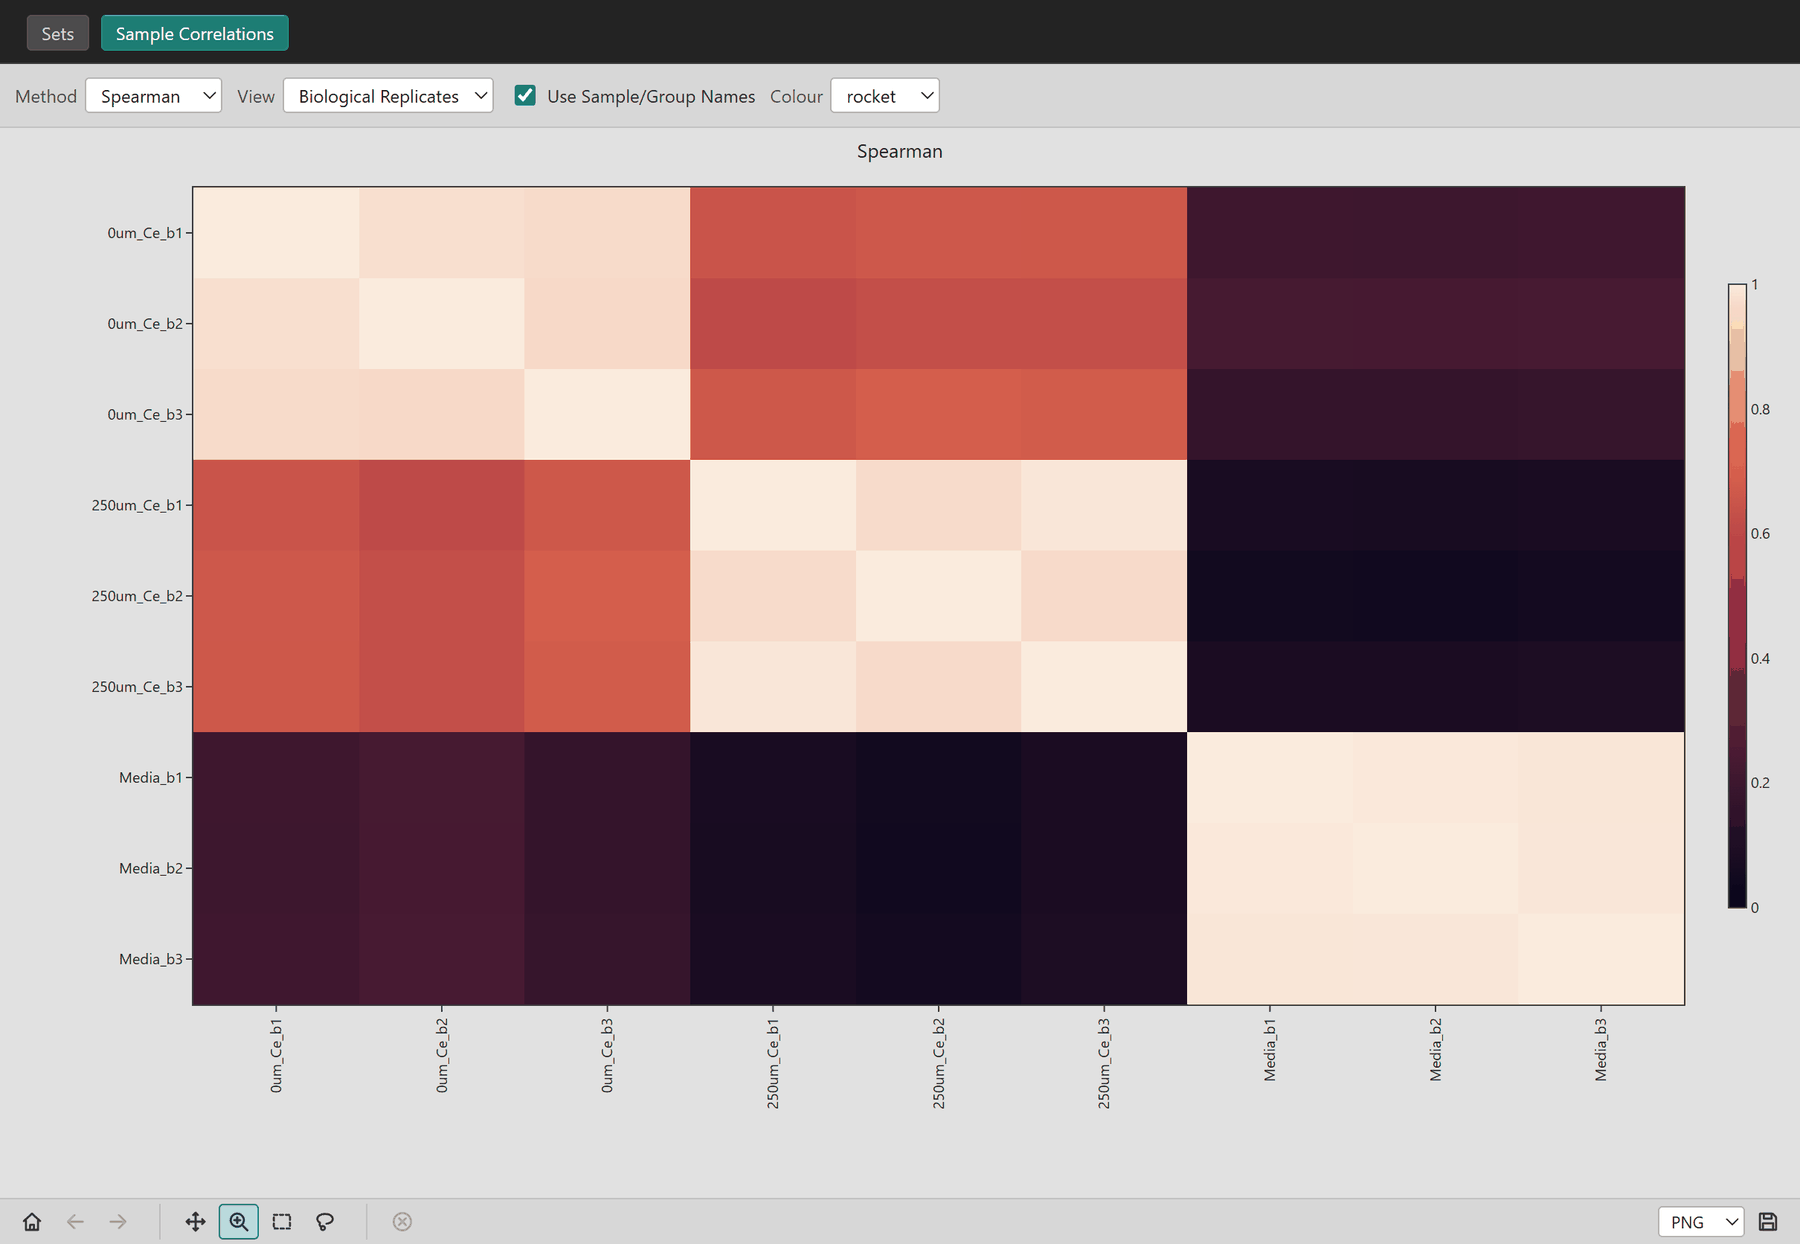
- Spearman (default): rank correlation of abundance profiles. It suits LC-MS data, whose abundances are far from normally distributed. The colour scale runs from 0 to 1 because real samples almost always correlate positively.
- Jaccard: similarity of which features are present, ignoring how much.
- Bray-Curtis: abundance-weighted similarity, the usual measure in ecology and the one NMDS uses on the Multivariate tab.
View
- Biological Replicates (default): technical replicates are averaged, one row per sample.
- Individual Injections: one row per injection.
- Biological Groups: one row per group.
Use Sample/Group Names replaces injection file names with short labels:
<group>_b<n> for the nth biological replicate and <group>_b<n>_s<m> for its
mth injection. Colour changes the colour map.
Click a cell to select that sample's injection.