Heatmap
Every filtered feature (rows) in every injection, sample or group (columns). Each row is scaled between its own minimum and maximum, then rows and columns are both clustered (Ward linkage, Euclidean distance).
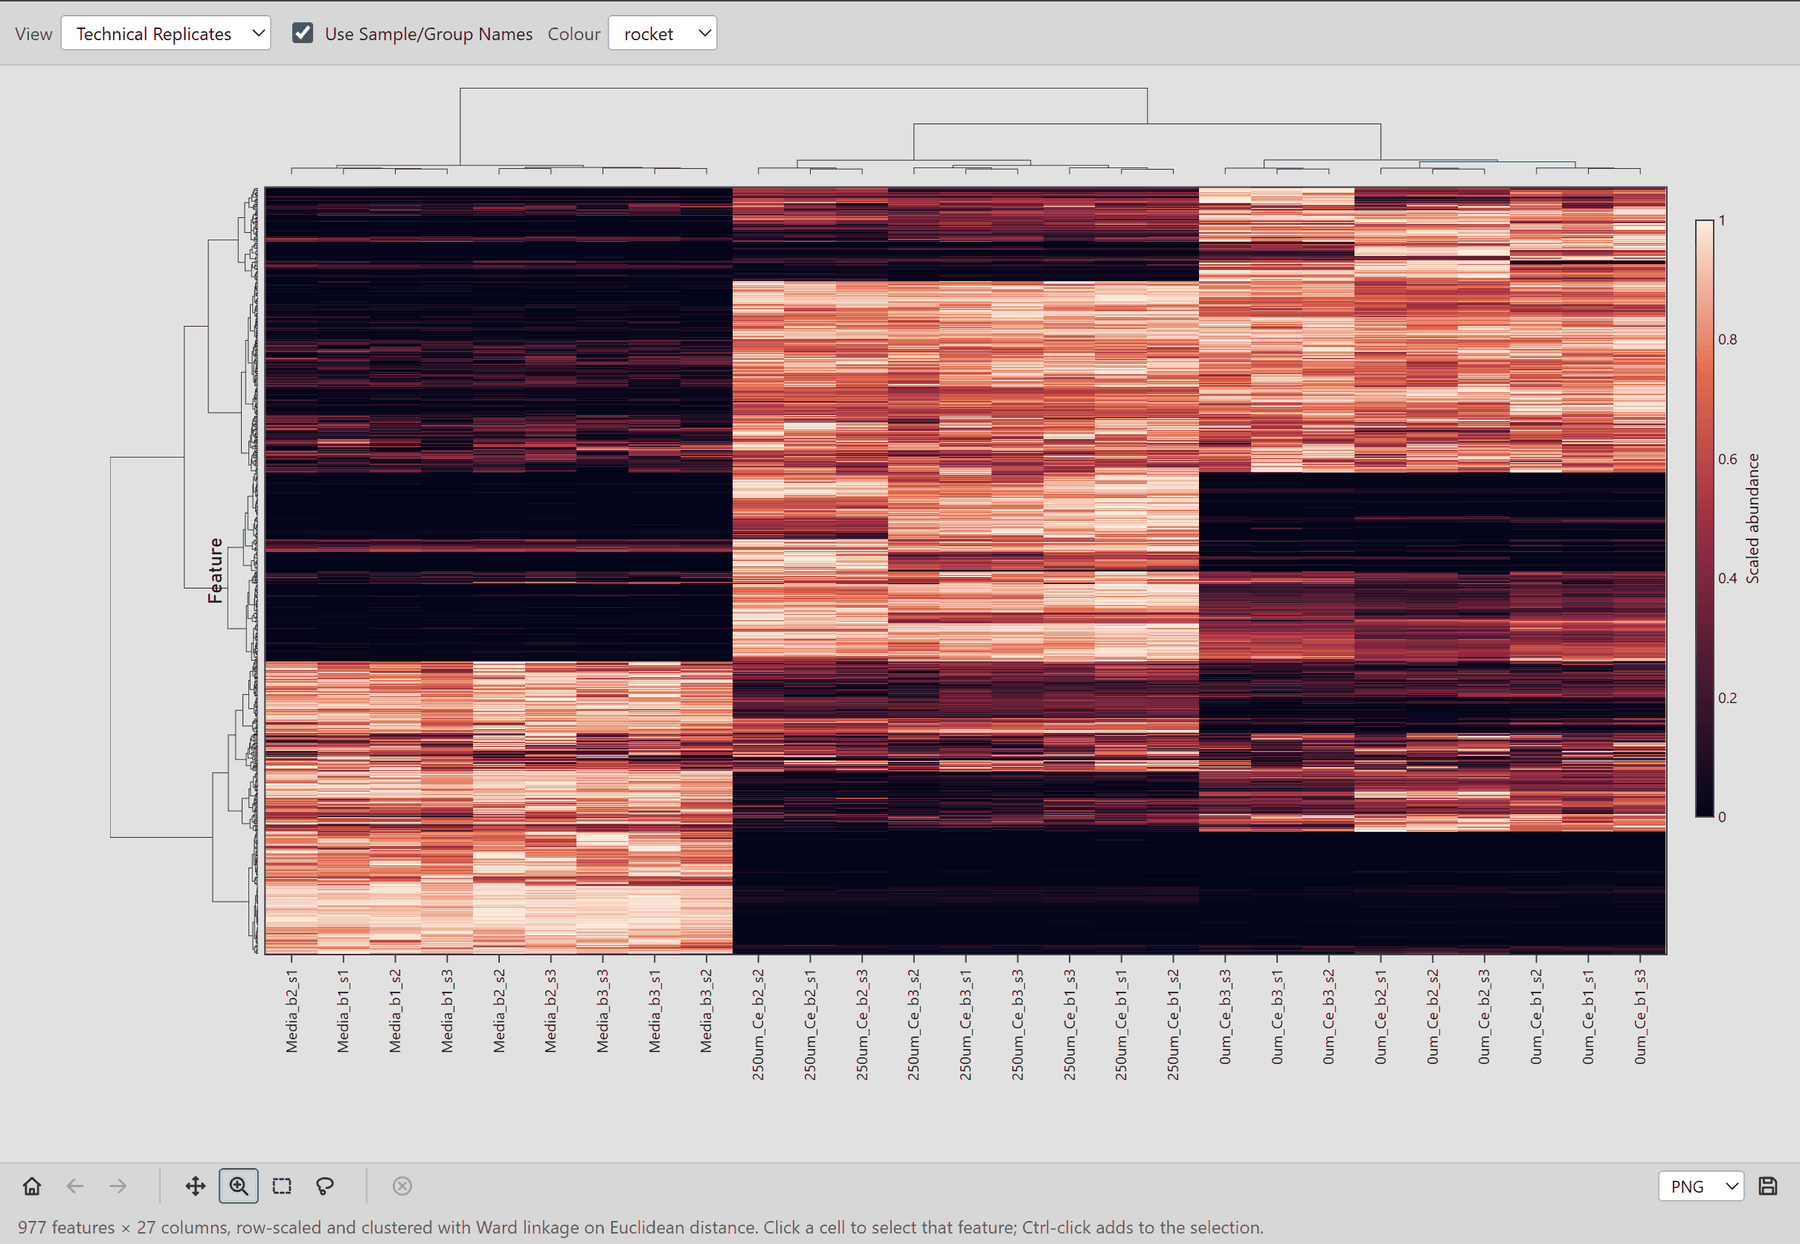
Columns that cluster together have similar overall profiles, like the Dendrogram, although the order can differ slightly because the heatmap uses scaled data. Rows that cluster together rise and fall together across samples, which makes co-regulated groups of features easy to pick out.
Controls
- View: Technical Replicates (one column per injection), Biological Replicates (one per sample) or Biological Groups (one per group).
- Use Sample/Group Names: short
<group>_b<n>_s<m>labels instead of injection file names. - Colour: the colour map. All six options are perceptually uniform.
Click a cell to select its feature; Ctrl + click adds to the selection.
Very large datasets are drawn with at most 1,500 rows by default. Past that,
neighbouring rows in the clustered order are averaged for display. The limit
is a server setting
(MPACT_MAX_HEATMAP_ROWS).